USING MOLECULAR BANDS TO MEASURE
STARSPOT PROPERTIES
JAMES NEFF (
DOUG O'NEAL (
STEVE
for more details, see...
neffj.people.cofc.edu/WWW/pr_tio.html
Presented
ABSTRACT:
Using visual and near-infrared spectra of various molecular bands, we
can directly measure the TEMPERATURE
and total AREA of starspots.
WHY USE MOLECULAR BANDS?
· starspots => photometric
and spectroscopic variability
· light-curve
analysis => 1-dimensional spot
distribution
· Doppler
imaging => 2-dimensional
map of surface
· PROBLEMS
with these techniques...
§ no
variation from a symmetrically spotted star
§ images
provide only lower limit to spotted area
§ Doppler
imaging requires rapid rotation
§ only
one variable allowed; must assume the rest
· Ultimate
goal: molecular bands + photometry + Doppler imaging ==> unique image
of starspot distribution (over time)
HOW DO WE USE MOLECULAR
BANDS?
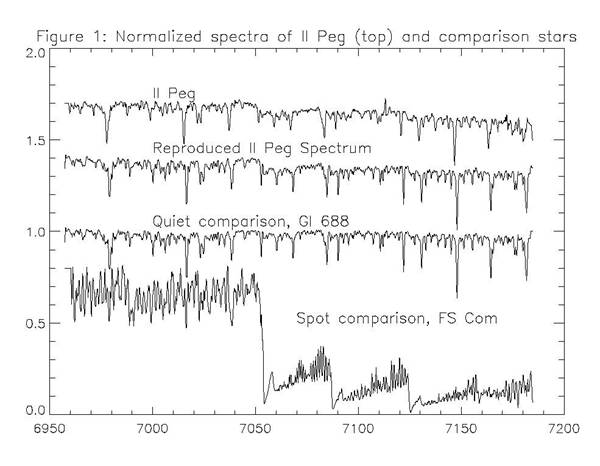
· starspot spectrum
differs radically from non-spotted (“quiet”)
· use
inactive stars to generate a “grid” of spot and quiet spectra
· absolute
depth of bands => spotted area (fs)
· relative
depth of bands => spot temperature (Ts)
Measurement
of Starspot Area and Temperature on II Pegasi in 1989 October, Neff, O'Neal, & Saar,
ApJ, 452, 879, 1995
·
developed,
described, & demonstrated technique
·
"Band-Depth
Index"; linear fit
·
large
comparison "grid"
·
II
Peg: Ts~3500; fs =
54 - 64% (fs = 34% @ Vmax)
·
McMath-Pierce; 6 nights; OCT 1989
Measurements
of Starspot Area and Temperature on Four Active,
Evolved Stars,
O'Neal, Saar, & Neff, ApJ,
463, 766, 1996
·
same
technique; applied to 5 active giant stars
·
bi-linear
fit to band-depth index
·
investigated
meaning of fs and Ts; estimate uncertainties
·
McMath-Pierce; 10 observing runs
OH 1.563
micron Absorption From Starspots on Active Stars, O'Neal, & Neff, AJ, 113, 1129, 1997
·
equivalent
width of OH line at 1.564 mm
·
sensitive
to higher temperatures; contrast better in IR
·
only
1 band; we assumed Ts from TiO results
·
KPNO
Coude Feed + NICMASS; 3 RS CVn
stars
Measurements
of Starspot Parameters on Active Stars using
Molecular Bands in Echelle Spectra, O'Neal, Neff, & Saar, ApJ, 507, 919, 1998
·
echelle spectra: many molecular bands
·
bands
have different sensitivities and temperature ranges
·
TiO 8860 A is critical!
·
fit
entire spectrum, not just band-depth
·
better
measures of Tq
·
compare
with chromospheric emission
·
KPNO/FOE;
Penn State/BMO; McDonald/2.1m cass echelle
Spectroscopic
Evidence for Non-Uniform Starspot Properties on II
Peg,
O'Neal,
·
6-night
run on II Peg at McDonald 2.1m
·
fs
roughly constant, but require multiple Ts
Hydroxl 1.53 micron Absorption From Starspots on Active Stars, O'Neal, Neff,
·
9
stars, including double-lined spect. binaries (e.g.
HR 1099)
·
PUBLICATIONS:
1.
Measurements
of Starspot Area and Temperature on II Pegasi In 1989 October, J.E. Neff, D. O'Neal, S.H. Saar,
ApJ, 452, 879, 1995.
2.
Measurements
of Starspot Area and Temperature on Four Active,
Evolved Stars, D. O'Neal,
S.H. Saar, J.E. Neff, ApJ,
463, 766, 1996.
3.
OH
1.563 micron Absorption From Starspots on Active Stars, D. O'Neal, J.E. Neff, AJ, 113, 1129, 1997.
4.
Spectroscopic
Evidence for Non-Uniform Starspot Properties on II
Peg, D. O'Neal, S.H. Saar, J.E. Neff, ApJ, 501, L73,
1998.
5.
Measurements
of Starspot Parameters on Active Stars using
Molecular Bands in Echelle Spectra, D. O'Neal, J.E. Neff, S.H. Saar,
ApJ, 507, 919, 1998.
6.
Hydroxl 1.53 micron Absorption From Starspots
on Active Stars, D. O'Neal,
J.E. Neff, S.H. Saar, J.K. Mines, AJ, 122, 1954,
2001.
Further references
are provided at....